Where are new jobs being created and where are the growth areas within Cambridgeshire?
The population of Cambridgeshire is forecast to grow by approximately 25% between 2013 and 2036 (Cambridgeshire Research Group’s 2013-Based Population Forecasts). The rise in population will be driven in part by significant housing developments within the County. Cambridgeshire experienced a 2.3% increase in employment during 2014 (Source: ONS). The East of England forecasting model suggests that total employment in terms of number of jobs will rise by 22% in Cambridgeshire between 2011 and 2031. The major areas of growth are predicted in engineering, manufacturing, Research & Development) R&D, science & technology, creative industries, bio-chemicals, agriculture, processing and tourism.
Cambridgeshire Growth and Economy – Research and Monitoring Group has been working on an open data project to estimate the number of employee jobs created in the year 2013-14. What methodology was used to extract the data? The data for the growth in employee jobs was extracted from the annual monitoring survey 2014, carried out by Cambridgeshire County Council. This survey monitors planning development in the County by use class. For the purposes of this report we focused on B use and retail classes, whilst any data which related to demolition on land was excluded as it does not contribute to a gain in employment.
The data is provided at district and parish level and in relation to local plan policy growth areas. The number of jobs to be created from each development for Class B and retail uses was extracted from planning applications submitted to the district councils between 1st April 2013 and 31st March 2014. The planning application form has a column for existing and proposed employees, and this information was used where it was provided. However, if these columns were left blank, we awarded a zero to indicate that whilst there is growth we are uncertain of the actual increase in the number of employees. Time permitting this can be rectified later by contacting the businesses individually and gaining the information about number of employees.
During the analysis it became apparent that the data collected was limited as few applicants had filled in the employee information and, where they had it had not been completed consistently. Ideally we would have looked at completions and commitments going further back to give a more complete picture of growth trends over time, however time constraints have restricted the analysis to 2013-14. The analysis is well worth doing, however, as it sets a marker in the ground, and can lead to more detailed studies of growth expectations in the region.
Findings
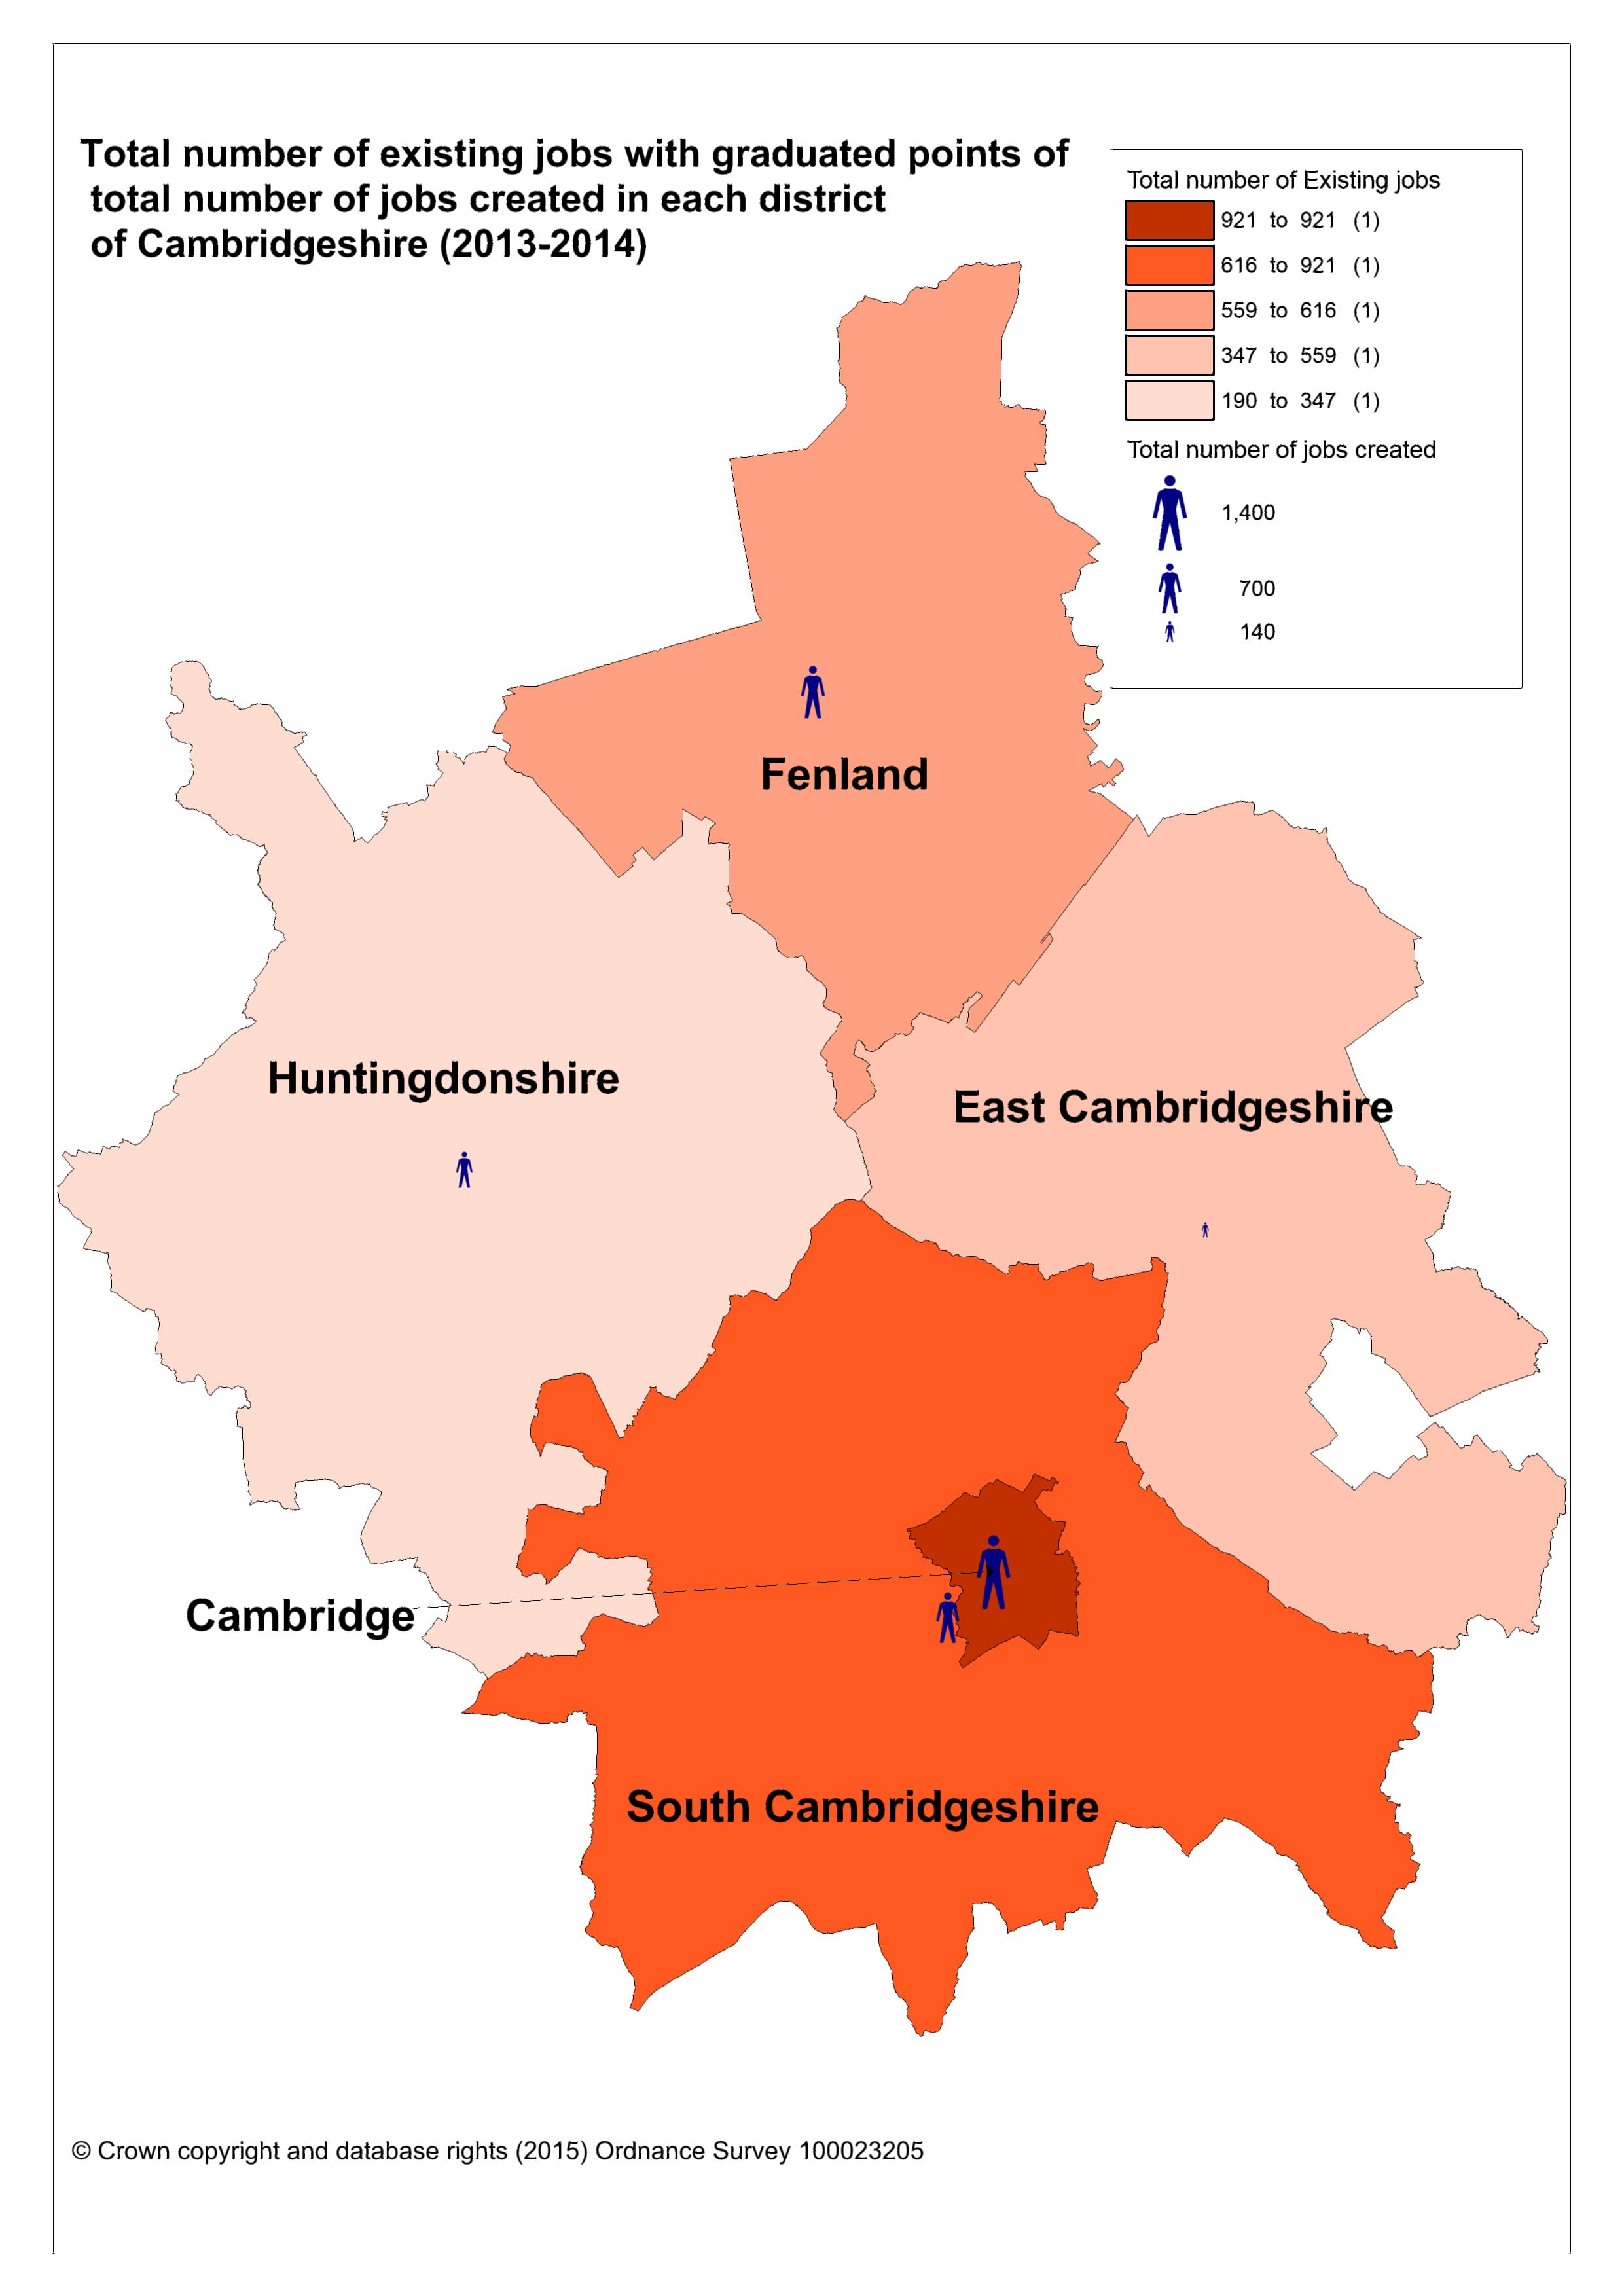
The results of our analysis are presented on a district-wide thematic map to show, at a glance, the number of existing employees, and with graduated points to show the number of employees expected to be gained. The map shows that the district with the highest number of existing jobs is Cambridge City, followed by South Cambridgeshire, while the least number of existing jobs are in Huntingdonshire. The total number of jobs created is highest in Cambridge City followed by Fenland.

The data was then analysed for each parish within each district. District-wide thematic maps were produced which show the number of existing employees with graduated points to show the number of employees expected to be gained by parish, and by ward for Cambridge City. The maps for the five districts are shown below.

Within Cambridge City the wards of Market and Romsey have the highest numbers of existing jobs, as well as the highest level of employee job creation. New job creation in most of the wards is in accordance with the growth areas outlined by the district in the local plan.

The East Cambridgeshire map shows the highest number of existing jobs is in the parish of Littleport, followed by Ely and Soham. The highest levels of employee job creation are in the parishes of Reach and Downham. New job creation in most of the parishes is in accordance with the growth areas mentioned by the district in the local plan apart from Fordham, where growth is planned but no employment growth has been identified through this analysis.

The Fenland map (above) shows the highest numbers of existing jobs are in the parishes of Wisbech and March. The highest levels of employee job creation are in Wisbech and Whittlesey parishes. The creation of new jobs in most of the parishes is in accordance with the growth areas mentioned by the district in the local plan.

The Huntingdonshire map (above) shows both the highest numbers of existing jobs and the highest levels of employee job creation are in the parishes of Yaxley and Huntingdon. New job creation in most of the parishes is in accordance with the growth areas mentioned by the district in the local plan apart from Spaldwick and Holywell-cum-Needingworth, where growth is planned but where no employment growth has been identified through this analysis.

The South Cambridgeshire map (above) shows the highest number of existing jobs in the parish of Bourn. The highest level of employee job creation is also in Bourn, as well as the parish of Duxford. New job creation in some of the parishes is in accordance with the growth areas mentioned by the district in the local plan. However, in some of the parishes, including Teversham, Fen Ditton, Haslingfield, Hauxton, Impington and Oakington and Westwick growth is planned but no employment growth has been identified by this analysis.
Providing the Basis for More Detailed Evaluation This analysis is extremely useful both for the information it provides and as it can then lead on to more detailed evaluation of growth expectations. Data can be looked at by growth areas to identify whether new permissions are located in the areas of growth designated in the districts’ local plans. As well as this, the data can also be analysed on the basis of other geographical areas / policy areas as required, as it can be manipulated through the use of mapped polygons. For example, the data can be mapped to see whether the new jobs are being created within the areas of housing and employment growth.
References
• Cambridgeshire Research Group 2013-based Population Forecasts http://www.cambridgeshireinsight.org.uk/population-and-demographics/popu…
• Office of National Statistics (ONS) http://www.ons.gov.uk/ons/index.html
• Cambridgeshire Annual Monitoring Survey 2013/14 http://opendata.cambridgeshireinsight.org.uk/dataset/retail-and-town-cen…
• Cambridgeshire Local Economic Assessment http://www.cambridgeshireinsight.org.uk/economy/localeconomicassessments
• Cambridge City Local Plan https://www.cambridge.gov.uk/local-plan-2006
• East Cambridgeshire Local Plan http://www.eastcambs.gov.uk/local-development-framework/east-cambridgesh…
• Fenland Local Plan http://www.fenland.gov.uk/core-strategy
• Huntingdonshire Local Plan http://www.huntingdonshire.gov.uk/Planning/Planning%20Policy/Pages/Local…
• South Cambridgeshire Local Plan https://www.scambs.gov.uk/content/local-plan-2004
For further information, contact:
Heather Doidge or Vandana Manocha – Planning Support Officers
Address: Cambridgeshire County Council, Shire Hall, Cambridge, CB3 0AP
Tel: 01223 699941, 01223 715684
Email: [email protected], [email protected]