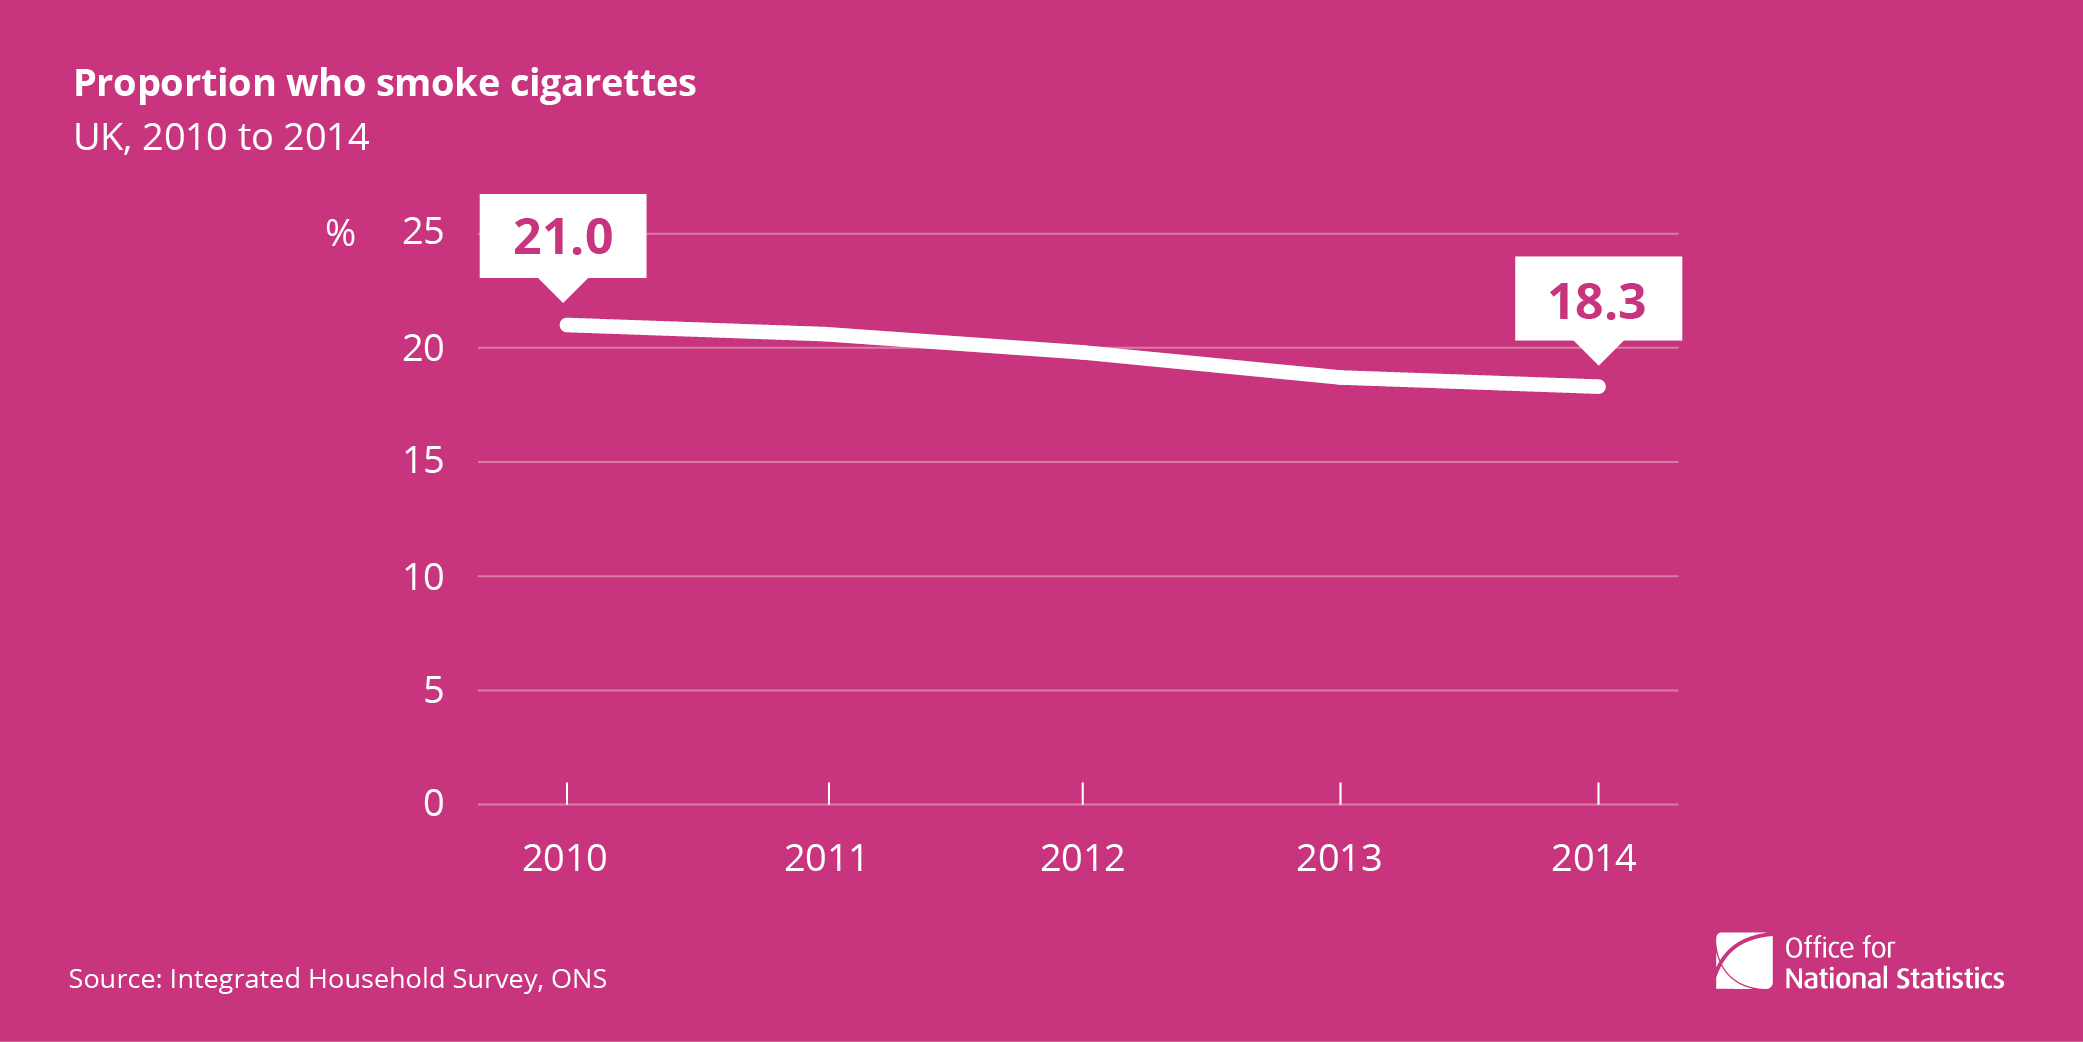
The proportion of adults who smoke in the UK has fallen from 21% in 2010 to 18.3% in 2014, according to the Integrated Household Survey. The Integrated Household Survey’s smoking prevalence data is a key measure for monitoring tobacco use …

Four facts about smoking in the UK 2014 Read more »

The Integrated Household Survey specifically provides data on sexual identity and smoking prevalence, which allows academics, government departments, and other stakeholders to provide evidence for planning, policy and monitoring purposes. See below five facts about sexual identity in the UK, …

Sexual identity in the UK 2014 Read more »

There are around 600 million people over the age of 60 across the globe; a figure which is expected to double by 2025, according to the United Nations. The organisation has designated October 1 as International Day of Older Persons (IDOP). UK Older …

Nine things you might not know about older people in the UK Read more »

This third outing in their data visualisation series is a more in depth look at the tools you can use for data visualisation, such as R and leaflet.js or Google Fusion. More information about the event, including details of how to …

Open Data Manchester Data visualisation series – Getting to grips with data Read more »

This is a slightly edited version of a post originally published on DATA.GOV.UK In my previous post I argued that a combination of ‘chance’ and open data can lead to good stuff happening. I supplied a few examples, and also …

Good stuff, continued Read more »

6.30pm – 8.30pm, Tuesday 29th September 2015 Greenheys Business Centre Manchester Science Park Pencroft Way Manchester M15 6JJ Map here Sign up on Eventbrite here The third outing in our data visualisation series is a more in depth look at the tools …

Data visualisation series – Getting to grips with data Read more »

In 1841 the average newborn girl was not expected to see her 43rd birthday. Thankfully times have changed and so have life expectancies in the 170 years since the first lifetable was constructed7. The information contained in the Decennial Life …

How has life expectancy changed over time? Read more »

(Graphic credit: Kate Hudson for the Data Journalism Handbook/Flickr) If you work with data, you’ve heard the three-letter initialism before. If you don’t, you’ve almost certainly seen others reference them in the context of powering data visualizations or listed as …

What are APIs? Why they matter and how to use them Read more »

Ok, this post provides a quick analysis of the Scenario. As a guide, this sort of analysis should take about 30 minutes. To get the most out of this exercise, read the scenario post, write your plan and then read this analysis. …

The Analysis Read more »